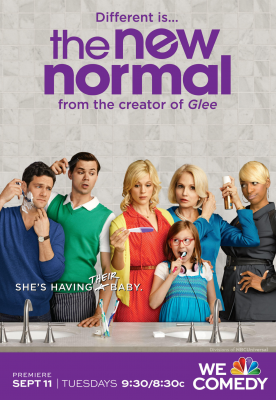
Revolving around a gay couple and their surrogate, The New Normal features the talents of Andrew Rannells, Justin Bartha, Georgia King, Ellen Barkin, NeNe Leakes, Bebe Wood, and Jayson Blair.
These are the TV show’s ratings for the 2012-13 season, the best way to tell if The New Normal is going to be cancelled or renewed for a second season. The show typically airs on Tuesday nights and NBC has ordered 13 22 episodes.
These figures will be updated as the weeks progress so be sure to bookmark and return to this page:
UPDATE: NBC has cancelled this show and won’t be bringing it back next season.
Final season averages: 1.6 rating in the 18-49 demographic with 4.10 million total viewers.
Episode 01-22: Tuesday, 04/02/13 (series or season finale?)
1.4 in the demo (-18% change) with 3.39 million (-24% change).
Season averages: 1.55 in the demo with 4.10 million.
Episode 01-21: Tuesday, 04/02/13
1.7 in the demo (+31% change) with 4.46 million (+34% change).
Season averages: 1.56 in the demo with 4.14 million.
Episode 01-20: Tuesday, 03/26/13
1.3 in the demo (+86% change) with 3.32 million (+57% change).
Season averages: 1.55 in the demo with 4.12 million.
Episode 01-19: Tuesday, 03/19/13
0.7 in the demo (-22% change) with 2.11 million (-14% change).
Season averages: 1.57 in the demo with 4.16 million.
Episode 01-18: Tuesday, 03/05/13
0.9 in the demo (-10% change) with 2.44 million (-7% change).
Season averages: 1.62 in the demo with 4.28 million.
Episode 01-17: Tuesday, 02/26/13
1.0 in the demo (+11% change) with 2.62 million (-6% change).
Season averages: 1.66 in the demo with 4.39 million.
Episode 01-16: Tuesday, 02/19/13
0.9 in the demo (-18% change) with 2.80 million (-9% change).
Season averages: 1.70 in the demo with 4.50 million.
Episode 01-15: Tuesday, 01/29/13
1.1 in the demo (-8% change) with 3.08 million (-6% change).
Season averages: 1.75 in the demo with 4.61 million.
Episode 01-14: Tuesday, 01/22/13
1.2 in the demo (-14% change) with 3.28 million (-2% change).
Season averages: 1.80 in the demo with 4.72 million.
Episode 01-13: Tuesday, 01/15/13
1.4 in the demo (+8% change) with 3.33 million (+3% change).
Season averages: 1.85 in the demo with 4.83 million.
1.3 in the demo (-24% change) with 3.23 million (-29% change).
Season averages: 1.88 in the demo with 4.96 million.
Episode 01-11: Tuesday, 12/04/12
1.7 in the demo (0% change) with 4.55 million (+13% change).
Season averages: 1.94 in the demo with 5.11 million.
Episode 01-10: Tuesday, 11/27/12
1.7 in the demo (+13% change) with 4.04 million (-6% change).
Season averages: 1.96 in the demo with 5.17 million.
Episode 01-09: Tuesday, 11/20/12
1.5 in the demo (-17% change) with 4.29 million (-8% change).
Season averages: 1.99 in the demo with 5.29 million.
Episode 01-08: Tuesday, 11/13/12
1.8 in the demo (+6% change) with 4.66 million (+8% change).
Season averages: 2.05 in the demo with 5.42 million.
Episode 01-07: Tuesday, 10/23/12
1.7 in the demo (-15% change) with 4.33 million (-11% change).
Season averages: 2.09 in the demo with 5.53 million.
Episode 01-06: Tuesday, 10/09/12
2.0 in the demo (+18% change) with 4.86 million. (+8% change).
Season averages: 2.15 in the demo with 5.73 million.
Episode 01-05: Tuesday, 10/02/12
1.7 in the demo (-15% change) with 4.50 million (-12% change).
Season averages: 2.18 in the demo with 5.90 million.
UPDATE: NBC has given The New Normal a full season pick up.
Episode 01-04: Tuesday, 09/25/12
2.0 in the demo (-9% change) with 5.09 million (-16% change).
Season averages: 2.30 in the demo with 6.25 million.
Episode 01-03: Tuesday, 09/18/12
2.2 in the demo (-12% change) with 6.08 million (-13% change).
Season averages: 2.40 in the demo with 6.64 million.
Episode 01-02: Tuesday, 09/11/12
2.5 in the demo (0% episode-to-episode change) with 6.96 million (+1% change)
Season averages: 2.50 in the demo with 6.92 million.
Episode 01-01: Monday, 09/10/12
2.5 rating in the 18-49 demographic with 6.88 million total viewers.
Season averages: 2.50 in the demo with 6.88 million.
The “special preview” of The New Normal had an okay start in the ratings. It won its timeslot but lost 40% of its lead-in audience. The numbers may have been negatively impacted by the fact that NBC released the pilot online weeks ago and they added this preview to the schedule just last week. Those who read TV Guide were expecting to see a new episode of Grimm.
On the plus side, NBC was up by 56% when compared to the 2011 timeslot occupant, the Miss Universe Pageant. Ultimately, the sitcom’s fate will become more clear as the weeks progress. The only thing we know right now is that it’s not a big hit or a big flop right out of the gate.
Note: These ratings are collected by the Nielsen company and are the final national numbers. These are different from the fast affiliate numbers which are just estimates of the actual ratings and are reported on by most other outlets. The final nationals are typically released within 24 hours of the programming or, in the case of weekends and holidays, a couple days later.
What do you think? Do you like The New Normal TV series? Do you think it should be cancelled or renewed for a second season?
You are currently viewing the mobile version of our site. View the full site to get free email alerts, vote on your favorite shows, comment, and more.
