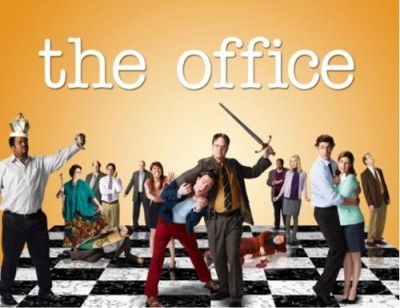
The ninth season of The Office typically airs Thursday nights at 9pm on the NBC network. There are 22 episodes.
This season, the cast includes Angela Kinsey, Brian Baumgartner, Catherine Tate, Craig Robinson, Creed Bratton, Ed Helms, Ellie Kemper, Jenna Fischer, John Krasinski, Kate Flannery, Leslie David Baker, Oscar Nuñez, Paul Lieberstein, Phyllis Smith, Rainn Wilson, and Zach Woods.
These are the TV show’s latest ratings for the 2012-13 season, ordinarily the best way to tell if The Office would be cancelled or renewed.
These figures will be updated as the weeks progress so be sure to bookmark and return to this page:
Final season averages: 2.0 rating in the 18-49 demographic with 4.09 million total viewers.
Episodes 09-24 & 09-25: Thursday, 05/16/13
3.0 in the demo (+30% change) with 5.69 million (+25% change).
Season averages: 2.04 in the demo with 4.09 million.
Thursday, 05/16/13 (retrospective)
2.1 rating in the 18-49 demographic with 4.43 million total viewers.
Episodes 09-22 & 09-23: Thursday, 05/09/13
2.3 in the demo (+28% change) with 4.56 million (+30% change).
Season averages: 2.04 in the demo with 4.09 million.
Episode 09-21: Thursday, 05/02/13
1.8 in the demo (+6% change) with 3.51 million (+8% change).
Season averages: 2.02 in the demo with 4.04 million.
Episode 09-20: Thursday, 04/25/13
1.7 in the demo (-11% change) with 3.25 million (-15% change).
Season averages: 2.03 in the demo with 4.07 million.
Episode 09-19: Thursday, 04/11/13
1.9 in the demo (+6% change) with 3.83 million (+11% change).
Season averages: 2.05 in the demo with 4.11 million.
Episode 09-18: Thursday, 04/04/13
1.8 in the demo (-5% change) with 3.44 million (-3% change).
Season averages: 2.06 in the demo with 4.13 million.
Episode 09-17: Thursday, 03/14/13
1.9 in the demo (-5% change) with 3.54 million (-13% change).
Season averages: 2.07 in the demo with 4.17 million.
Episode 09-16: Thursday, 02/14/13
2.0 in the demo (-5% change) with 4.06 million (-2% change).
Season averages: 2.08 in the demo with 4.20 million.
Episode 09-15: Thursday, 02/07/13
2.1 in the demo (+11% change) with 4.15 million (+5% change).
Season averages: 2.09 in the demo with 4.22 million.
Episode 09-14: Thursday, 01/31/13
1.9 in the demo (-10% change) with 3.97 million (-11% change).
Season averages: 2.09 in the demo with 4.23 million.
Episode 09-13: Thursday, 01/31/13
2.1 in the demo (+5% change) with 4.45 million (+6% change).
Season averages: 2.10 in the demo with 4.25 million.
Episode 09-12: Thursday, 01/24/13
2.0 in the demo (-5% change) with 4.19 million (+1% change).
Season averages: 2.10 in the demo with 4.23 million.
Episode 09-11: Thursday, 01/17/13
2.1 in the demo (-5% change) with 4.15 million (-9% change).
Season averages: 2.11 in the demo with 4.23 million.
Episode 09-10: Thursday, 01/10/13
2.2 in the demo (+5% change) with 4.54 million (+9% change).
Season averages: 2.11 in the demo with 4.24 million.
2.1 in the demo (+11% change) with 4.16 million (+7% change).
Season averages: 2.10 in the demo with 4.21 million.
Episode 09-08: Thursday, 11/29/12
1.9 in the demo (-10% change) with 3.88 million (-7% change).
Season averages: 2.10 in the demo with 4.21 million.
Episode 09-07: Thursday, 11/15/12
2.0 in the demo (-13% change) with 4.16 million (-14% change).
Season averages: 2.13 in the demo with 4.26 million.
Episode 09-06: Thursday, 11/08/12
2.4 in the demo (+26% change) with 4.83 million (+21% change).
Season averages: 2.13 in the demo with 4.28 million.
Episode 09-05: Thursday, 10/25/12
1.9 in the demo (-10% change) with 4.00 million (-7% change).
Season averages: 2.08 in the demo with 4.17 million.
Episode 09-04: Thursday, 10/18/12
2.1 in the demo (-5% change) with 4.28 million (+3% change).
Season averages: 2.13 in the demo with 4.21 million.
Episode 09-03: Thursday, 10/04/12
2.2 in the demo (+5% change) with 4.14 million (0% change).
Season averages: 2.13 in the demo with 4.18 million.
Episode 09-02: Thursday, 09/27/12
2.1 in the demo (0% change) with 4.13 million (-4% change).
Season averages: 2.10 in the demo with 4.21 million.
Episode 09-01: Thursday, 09/20/12
2.1 rating in the 18-49 demographic with 4.28 million total viewers.
Season averages: 2.10 in the demo with 4.28 million.
It wasn’t a positive start to the final season. Compared to last season’s opener, The Office was down by a whopping 46% in the demo (vs a 3.9 rating) and down by 44% in viewership (vs 7.64 million). This sitcom was the network’s top scripted show but it seems those days are certainly gone.
Reference point: The eighth season averaged a 2.8 rating in the 18-49 demographic and 5.39 million viewers.
Note: These ratings are collected by the Nielsen company and are the final national numbers. These are different from the fast affiliate numbers which are just estimates of the actual ratings and are reported on by most other outlets. The final nationals are typically released within 24 hours of the programming or, in the case of weekends and holidays, a couple days later.
What do you think? Do you still like The Office TV series? Do you think it should be ending or would you like to see season 10 instead?
| Amazon.com Widgets |
You are currently viewing the mobile version of our site. View the full site to get free email alerts, vote on your favorite shows, comment, and more.
